
Every experienced trader remembers the first time a "sure thing" rally rolled over and never came back. Price climbed, stalled, curved gently lower, bounced once, and then collapsed. In hindsight, the warning signs were clear. That shape has a name: the inverted cup and handle.
After two decades of watching charts across stocks, forex, and crypto, I can say this pattern is one of the more reliable bearish setups available. However, it only works when you trade it with discipline. In this guide, you'll learn how the pattern forms, what drives it, and exactly how to trade it step by step.
What Is the Inverted Cup and Handle Pattern?
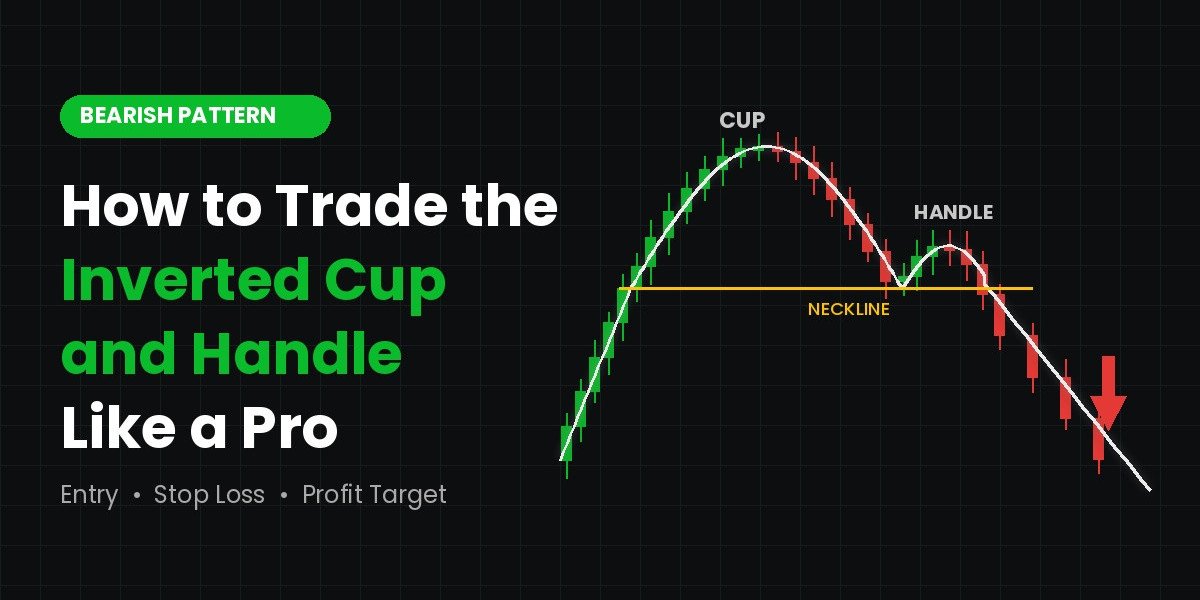
The inverted cup and handle pattern is a bearish chart formation. It looks like an upside-down cup with a small handle on the right side. In simple terms, it signals that buyers are losing control and sellers are preparing to take over.
The pattern usually appears in two situations. First, it can form at the top of an uptrend, where it acts as a reversal signal. Second, it can appear during a downtrend, where it signals that the decline will likely continue. Either way, the message is the same. Selling pressure is building.
Most traders know the classic cup and handle chart pattern, which is bullish. The inverted version simply flips that logic. Instead of a rounded bottom followed by a breakout, you get a rounded top followed by a breakdown.
The Anatomy of a Bearish Cup and Handle
To trade any pattern well, you need to recognize its parts clearly. A bearish cup and handle has three key components.
1. The Cup (Rounded Top)
The cup forms when price rises, slows down, and then curves back down. A good cup looks like a smooth dome, not a sharp spike. The rounded shape matters. It shows a gradual shift in sentiment rather than a sudden, emotional reaction.
Ideally, both sides of the cup should reach a similar price level at their base. This base becomes your most important reference point.
2. The Handle
After the cup completes, price usually bounces upward for a short time. This small rally is the handle. It represents the last attempt by buyers to push price higher.
A healthy handle is shallow. In my experience, it should retrace no more than about one-third to one-half of the cup's height. If the handle climbs too high, the pattern loses strength. Also, the handle typically forms over a shorter period than the cup.
3. The Neckline (Support Level)
The neckline is a horizontal or slightly sloped line drawn along the lows of the cup. It acts as support. As long as price stays above it, the pattern is incomplete. Once price closes below it, the pattern is confirmed.
Inverted vs. Classic Cup and Handle Chart Pattern
It helps to compare the two versions side by side in your mind.
The classic cup and handle chart pattern forms a "U" shape. Price drops, rounds out a bottom, rallies to resistance, pulls back slightly into a handle, and then breaks out upward. Traders buy that breakout.
The inverted version does the opposite. Price rises, rounds out a top, falls to support, bounces slightly into a handle, and then breaks down. Traders sell or short that breakdown.
Because of this mirror relationship, many of the same rules apply. For example, volume confirmation, patience, and measured-move targets work in both cases. Nevertheless, bearish moves often unfold faster than bullish ones. Fear tends to move markets more quickly than greed. As a result, you should be ready to act promptly once the breakdown appears.
The Psychology Behind the Pattern
Charts are simply a picture of human behavior. Understanding that behavior gives you an edge.
During the left side of the cup, buyers are confident. Price rises steadily. Then, near the top, momentum fades. Early buyers start taking profits, and new buyers hesitate. Consequently, price begins to curve lower.
On the right side of the cup, sellers gain confidence. Price drifts back to the earlier support zone. At this point, some traders see a bargain and buy. This creates the handle.
However, the handle bounce is weak. Buyers cannot push price back toward the highs. Once they give up, support breaks. Stop losses trigger, trapped buyers exit, and short sellers step in. That combination often produces a sharp move lower.
How to Trade the Inverted Cup and Handle: Step-by-Step
Now let's get practical. Here is the exact process I use when learning how to trade the inverted cup and handle on any market or timeframe.
Step 1: Confirm the Market Context
First, look at the bigger picture. Is the pattern forming after an extended rally? Or is it appearing within a larger downtrend? Both can work. Still, the pattern tends to perform best when it aligns with the higher timeframe trend.
For instance, if the daily chart is bearish, an inverted cup and handle on the four-hour chart carries more weight.
Step 2: Identify the Cup and Handle Clearly
Next, check the shape. The cup should be rounded and reasonably symmetrical. The handle should be small and should not exceed the midpoint of the cup. If you have to squint or force the pattern, skip it. Good setups are usually obvious.
Step 3: Draw the Neckline
Then, connect the lows at the base of the cup. This line is your trigger level. Mark it clearly on your chart so you don't have to make decisions in the heat of the moment.
Step 4: Wait for a Confirmed Breakdown
This step separates professionals from beginners. Do not enter just because price touches the neckline. Instead, wait for a candle to close below it. A close confirms that sellers have genuinely taken control.
Many traders enter too early and get caught in false moves. Patience here saves money.
Step 5: Check Volume
Volume adds conviction. Ideally, volume should rise during the breakdown. Meanwhile, volume during the handle should be relatively light. Weak volume on the handle shows little buying interest. Strong volume on the breakdown shows real selling pressure.
If the breakdown happens on low volume, be cautious. The move may lack follow-through.
Step 6: Choose Your Entry Method
You have two main options:
- Aggressive entry: Enter immediately after the candle closes below the neckline. This approach catches the full move but carries a higher risk of false breakdowns.
- Conservative entry: Wait for price to retest the broken neckline from below. Old support often becomes new resistance. Enter when price rejects that level. This approach offers better confirmation, although you may miss some fast moves.
Neither method is "correct." Choose the one that fits your personality and risk tolerance, and then stay consistent.
Step 7: Place Your Stop Loss
Your stop loss protects your account if the pattern fails. The most common placement is just above the handle's high. If price climbs back above that level, the bearish idea is no longer valid.
Conservative traders sometimes place stops slightly higher to allow for normal volatility. Either way, always know your exit before you enter.
Step 8: Set a Profit Target
To estimate a target, measure the height of the cup from its peak to the neckline. Then project that same distance downward from the breakdown point. This is known as the measured-move method.
For example, if the cup is 10 points tall and the neckline sits at 100, your first target would be around 90. Many traders take partial profits at this level and trail their stop for the rest.
Tools That Improve Confirmation
Although the pattern can stand alone, combining it with other tools improves accuracy. Here are a few I have found consistently useful.
RSI divergence: When price makes a similar or higher high during the cup, but the RSI makes a lower high, momentum is weakening. This divergence supports the bearish case.
Moving averages: If price breaks below a key moving average, such as the 50-period, around the same time as the neckline, the signal becomes stronger.
Higher timeframe resistance: A cup that forms beneath a major resistance zone often has better odds. In that case, sellers are already active in that area.
Market structure: Look for lower highs forming within the handle. This shows buyers are steadily losing strength.
Common Mistakes to Avoid
Even experienced traders make errors with this setup. Fortunately, most of them are avoidable.
Forcing the pattern. Not every rounded top is an inverted cup. If the shape is messy or unclear, move on.
Entering before confirmation. A touch of the neckline is not a breakdown. Wait for the close.
Ignoring the handle's depth. A handle that retraces most of the cup signals strong buyers. That weakens the setup considerably.
Skipping the stop loss. No pattern works every time. Without a stop, one failed trade can erase many winners.
Overlooking news events. Earnings reports, central bank decisions, and economic data can override any chart pattern. Therefore, check the calendar before entering.
Risk Management: The Real Professional Edge
Here is an honest truth from years of trading. Pattern recognition is only half the job. Risk management is the other half, and arguably the more important one.
Start by risking a small, fixed percentage of your account on each trade. Most professionals risk between 1% and 2%. This way, a string of losses won't cripple your capital.
Also, aim for a reward-to-risk ratio of at least 2:1. If your stop is 5 points away, your target should be at least 10 points away. With that ratio, you can be wrong more often than you're right and still stay profitable.
Finally, keep a trading journal. Record each setup, your entry, your exit, and the result. Over time, you'll see which conditions produce your best trades. That data becomes your personal edge.
A Practical Example
Let's walk through a simple hypothetical scenario.
Imagine a stock rallies from 80 to 110 over several weeks. Near 110, momentum stalls. Price curves gradually lower and returns to 100, forming the cup. Next, it bounces to 104 on light volume, creating the handle. The neckline sits at 100.
A few days later, a candle closes at 98 on heavy volume. That's your confirmation. An aggressive trader might enter a short at 98. A conservative trader would wait for a retest near 100 that fails.
The stop goes just above the handle high, around 105. Meanwhile, the cup height is 10 points (110 minus 100). So the measured-move target is roughly 90.
In this case, the risk is about 7 points, and the potential reward is about 8 to 10 points. That's acceptable, though not ideal. A disciplined trader might wait for the retest entry to improve the ratio. This kind of thinking is what separates consistent traders from gamblers.
Final Thoughts
The inverted cup and handle is a powerful tool when you respect its rules. Look for a clean, rounded top. Make sure the handle stays shallow. Wait for a confirmed close below the neckline, and let volume support your decision. Above all, protect your capital with a clear stop loss and sensible position sizing.
Like any skill, reading this pattern improves with practice. Study past charts, mark every example you find, and review how each one played out. Over time, spotting the setup will become second nature. At GainzAlgo, we believe education should always come before any indicator or tool. In fact, traders often ask us, "is GainzAlgo legit?" Our honest answer is that no tool can replace a trader's own understanding of patterns, risk, and discipline. Signals and alerts can support your analysis; however, they work best when you already know why a setup like this one matters.